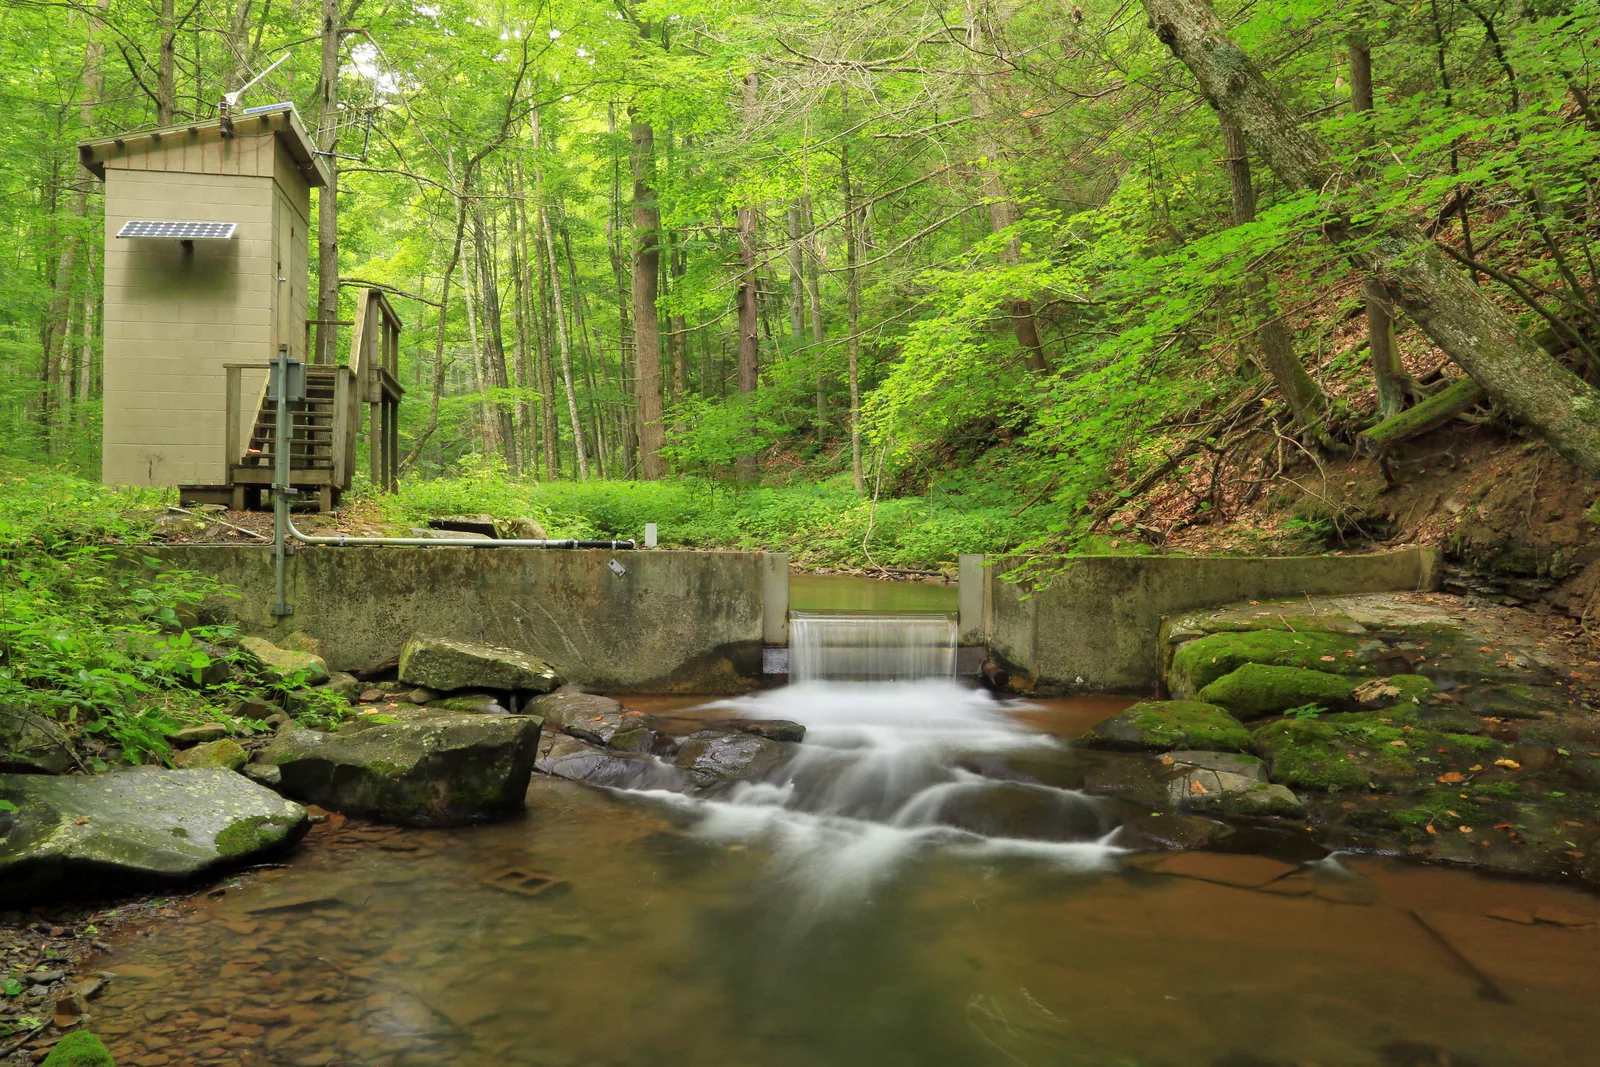
The lake water temperature you can trust is the one you measure yourself, a foot down in the shade, at the spot you fish; everything you can look up from the couch is either the surface skin, a point miles from your ramp, or an estimate. The good news is that those lookups are free, they take two minutes, and they are usually close enough to decide which lures go in the boat. After this page you will know the four ways to get the number, from most exact to least, which one your lake actually has, and how to read a reading taken somewhere else without being fooled by it.
We checked 20 famous bass and walleye lakes on October 10, 2026. Only two had a public live sensor on the lake itself. For fourteen the nearest reading was a river gauge, and on Lake Lanier that gauge sat at 51.6 °F (10.9 °C) below Buford Dam while the afternoon air was 70 °F (21 °C).
1. Measure it yourself, where you fish
A pocket thermometer is the only method that reports the water your lure is in. Hang it a foot (30 cm) down on the shaded side of the boat or dock, give it a full 60 seconds, then read it in the water, not after it has sat in the air. For a second number, drop a probe or a weighted thermometer to the depth you are fishing: the top foot of a summer lake can run 20 °F (11 °C) warmer than the water fifteen feet down, which is why the surface reading alone tells you so little in July.
Your sonar gives you a temperature too, but the sensor sits in the transducer at the hull, so it reads the surface skin where the boat is sitting and nothing deeper. It is still worth watching while you run: a creek arm that reads 4 °F (2 °C) warmer than the main lake in April is the arm with the prespawn bass in it. Which thermometer to buy, from a $10 analog in a brass case to a probe that logs temperature by depth, is on the fishing thermometer page.
2. Live sensors: USGS and NOAA
The United States Geological Survey runs the largest free network of water sensors in the country. Its National Water Dashboard lists over 13,500 real-time stream, lake, reservoir, precipitation, water-quality and groundwater monitoring locations, and many of them report water temperature. Open Water Data for the Nation, zoom the map to your lake, and filter to the water-temperature parameter (USGS code 00010, “Temperature, water”). Readings are typically 15 to 60 minutes old and marked provisional, which means nobody has checked them yet; for a fishing decision that is plenty. If a bookmark or app you use still points at the old waterservices.usgs.gov site, change it: USGS has announced it will slow those requests from November 16, 2026 and switch the site off on February 22, 2027.
On the Great Lakes, the National Weather Service’s Great Lakes observations page lists the past 48 hours of readings per lake, sortable by water temperature, and NOAA’s Tides and Currents stations give the shoreline number minutes old: 237 water-temperature stations nationwide, 22 of them on the Great Lakes, from Toledo and Marblehead on Lake Erie to Duluth on Superior. For a daily whole-lake picture, NOAA CoastWatch’s GLSEA map paints the surface temperature of all five lakes from AVHRR and VIIRS satellite passes, updated every day from the cloud-free parts of the previous day’s imagery, with a smoothing routine filling the gaps.
That is the network. Now the honest part: how much of it is near the lakes anglers drive to? We looked up the nearest public sensor with a fresh reading for 20 well-known bass and walleye lakes, using the USGS Water Data API and NOAA’s station list, all on the same October afternoon.
| Lake | Nearest live reading | What it measures | Distance | Reading that day |
|---|---|---|---|---|
| Lake Champlain, VT | USGS, Lake Champlain at Burlington | the lake | 4 mi (7 km) | 59.2 °F (15.1 °C) |
| Lake Erie west basin, OH | NOAA, Marblehead | the lake | 11 mi (18 km) | 64.2 °F (17.9 °C) |
| Lake St. Clair, MI | USGS, Clinton River at Mt. Clemens | river (NOAA Algonac at the lake head, 15 mi) | 15 mi (24 km) | 60.3 °F (15.7 °C) |
| Table Rock Lake, MO | USGS, White River below Table Rock Dam | tailwater | 5 mi (8 km) | 55.9 °F (13.3 °C) |
| Lake Lanier, GA | USGS, Chattahoochee River at Buford Dam | tailwater | 10 mi (16 km) | 51.6 °F (10.9 °C) |
| Lake Murray, SC | USGS, Saluda River below Lake Murray Dam | tailwater | 8 mi (13 km) | 59.7 °F (15.4 °C) |
| Lake Winnebago, WI | USGS, Fox River at Appleton | river | 14 mi (22 km) | 63.1 °F (17.3 °C) |
| Lake Minnetonka, MN | USGS, Shingle Creek, Minneapolis | creek | 16 mi (26 km) | 62.1 °F (16.7 °C) |
| Clear Lake, CA | USGS, Russian River near Hopland | river | 18 mi (29 km) | 58.1 °F (14.5 °C) |
| Candlewood Lake, CT | USGS, Saugatuck River (tidal) | salt estuary | 27 mi (43 km) | 62.1 °F (16.7 °C) |
| Lake Eufaula, OK | USGS, Illinois River near Gore | river | 33 mi (53 km) | 75.7 °F (24.3 °C) |
| Lake Okeechobee, FL | USGS, St. Lucie River at Stuart | river | 38 mi (61 km) | 84.6 °F (29.2 °C) |
| Lake Guntersville, AL | USGS, Terrapin Creek at Ellisville | creek | 38 mi (62 km) | 66.2 °F (19.0 °C) |
| Lake Havasu, AZ | USGS, drain below Tyson Wash, Ehrenberg | irrigation drain | 51 mi (81 km) | 63.9 °F (17.7 °C) |
Two of 20 lakes have a sensor on the water. Fourteen get a river, creek or estuary gauge. The six that are missing from the table are six of the most-fished reservoirs in the country, and they have nothing live within 50 mi (80 km): Lake Fork, Sam Rayburn and Toledo Bend in Texas, Lake of the Ozarks, Kentucky Lake and Mille Lacs (the last three have gauges in range, but none with a reading newer than a day). The tailwater rows are the trap: the water below a dam comes out of the cold bottom of the reservoir, so Lanier’s gauge read 51.6 °F (10.9 °C) on a day when the lake’s shallow coves were far warmer. A river gauge upstream of the lake is a better stand-in than a tailwater, and a creek is closer to what a shallow bay is doing than either. Before you trust any reading, check three things: what kind of water the station sits in, how far it is from your ramp, and how old the reading is.
3. Satellite and model sites
Two fishing apps sell the gap the sensors leave. LakeMonster draws water temperature for approximately 17,000-plus lakes from infrared satellite readings of the surface, refreshed every 1 to 5 days depending on satellite passes and cloud cover; the layer is part of Pro, at $8.50 a month or $79 a year. Omnia Fishing runs a similar layer in its paid tier, and its own explainer is admirably blunt: the satellites that carry the right sensor pass a given lake only about every 8 days, clouds block readings, and the layer is most accurate as a historical view of warming and cooling trends rather than exact, real-time readings. Both companies say the same thing about depth: the number is the surface, and the fish are usually not there.
So use them the way they are built to be used. A satellite trend that shows your lake climbing from 52 °F to 58 °F (11 to 14 °C) over ten April days tells you the prespawn is on, even if the number on the screen is three days old and 2 °F off. What it cannot tell you is whether this morning’s cold front knocked the shallows back; that is a thermometer job.
4. The estimate from air temperature
When there is no sensor, no subscription and no thermometer yet, the air temperature is a better guide than most anglers think, as long as you use the right air temperature. A lake does not follow today’s thermometer; it follows a running average of the past days. Kettle and colleagues, modeling lake surface temperatures for Limnology and Oceanography in 2004, fitted an exponential smoothing of air temperature and got a 35 percent better fit than raw air temperature. A 2019 study of hourly readings in Lake Kierskie in Poland found the strongest correlation between water and air at a 24-hour lag, and more than half of all days moved the water by less than 1.8 °F (1 °C). Matuszek and Shuter built lake-by-lake littoral-zone models for 14 Ontario lakes from average air temperature and day of year alone, and the air2water model from Piccolroaz and colleagues reproduced 27 years of Lake Superior surface temperature using air temperature as its only input.
The rule of thumb that falls out of this, and it is a rule of thumb, not a measurement: take the mean air temperature of the past five to seven days, not the forecast high. In spring, on a sunny afternoon, a shallow bay with a dark bottom runs a few degrees above that mean, and the main lake runs below it; the shallow water warms fast, the deep water is still carrying winter. In fall it flips: the lake has stored a summer of heat, so the water runs warmer than the air, and the first cold nights cool the air far faster than they cool the lake. A warm front in March that lifts the air to 65 °F (18 °C) for one day moves a bass lake by a degree, not by ten.
Reading the number right
Whatever the source, four habits keep a temperature from misleading you.
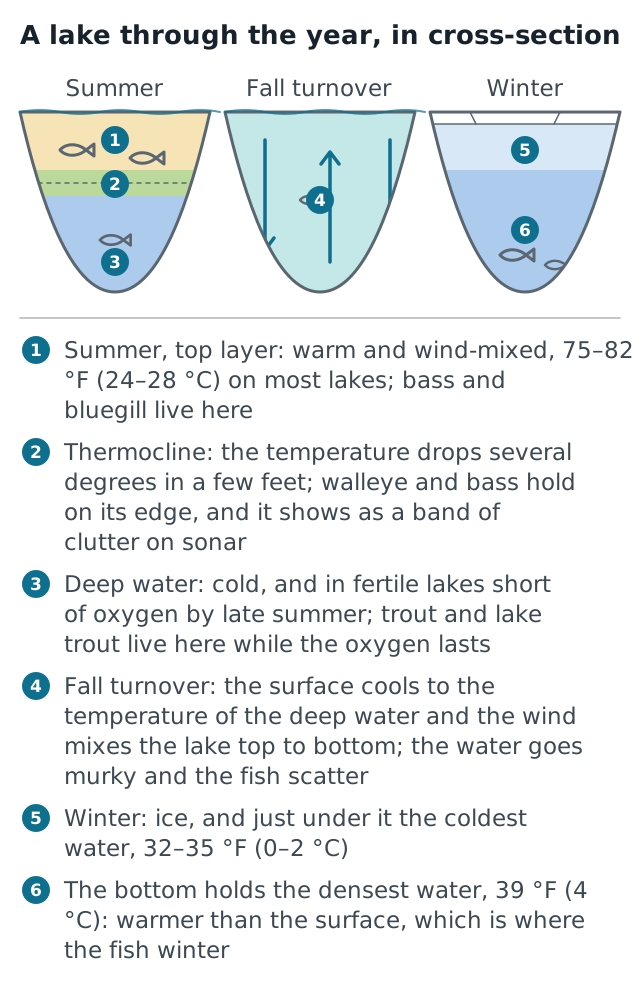
Surface is not depth. From late spring a lake deeper than about 20 ft (6 m) splits into a warm top layer, a thermocline where the temperature falls fast, and cold water underneath. Every satellite layer, the sonar readout and most gauges report the top of that stack. The lake turnover page shows how the layers build and when they collapse in fall; until they do, the number that matters for a walleye in August is the one at the thermocline, not the 82 °F (28 °C) on the screen.
Time of day. A surface reading at 7 a.m. is the day’s low; by mid-afternoon a sheltered flat can be several degrees warmer. Compare morning with morning, and if the app does not say when the reading was taken, assume it was the warmest part of the day.
Trend beats level. Three days of rising readings matter more than any single value. The bass that respond to 55 °F (13 °C) are responding to the fact that it was 50 °F (10 °C) last week, which is why the bass water temperature chart is written in bands and directions rather than single numbers; the walleye page works the same way.
Put the number to work. Once you have it, set it on the thermometer on the water temperature hub and it sorts 25 species into spawning, feeding, slow and too warm for that reading. Reading the sonar’s temperature box, and what the rest of the screen says about where the thermocline sits, is on the how to read a fish finder page.
Related
Section guide
Ideal Water Temperature for Fish: The Chart for 25 Freshwater SpeciesMost freshwater fish bite best at 65–75 °F, trout at 50–65 °F, catfish at 75–85 °F. One chart for 25 species: feeding range, spawn and shutdown.
 Lake Turnover: How Fall Mixing Works and Where the Fish Go
Lake turnover is the fall mixing that ends the summer thermocline: what sets it off, how long it lasts, seven signs it happened, where the fish go.
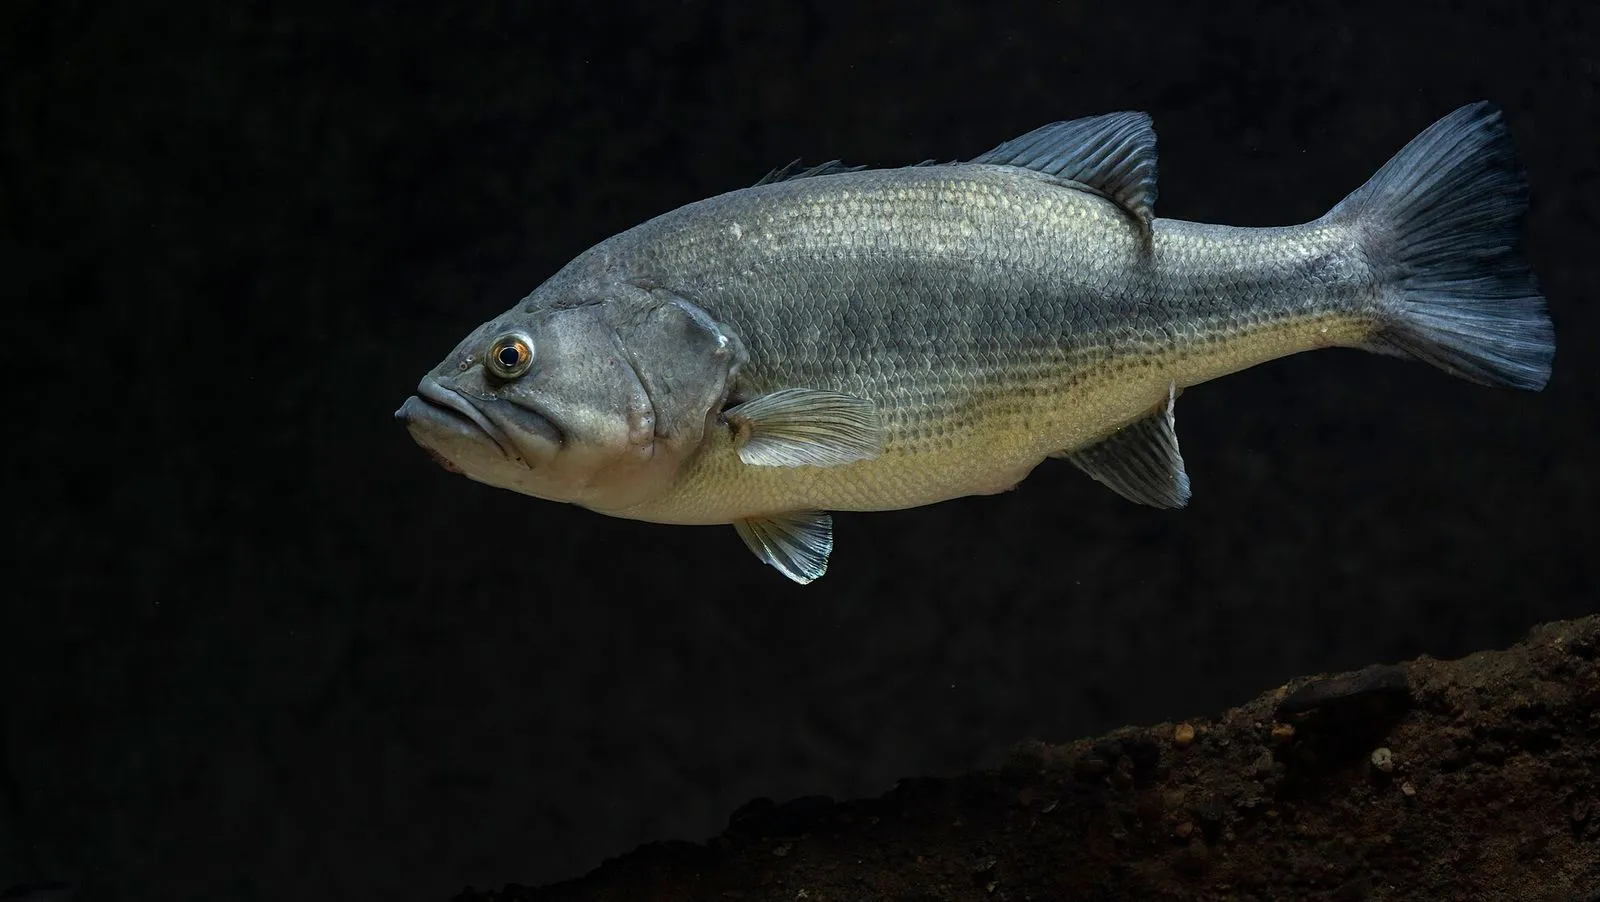 Bass Water Temperature: Spawn, Bite and What to Throw at Each Band
Bass bite best at 65–80 °F and spawn at about 60 °F. A band-by-band table of where bass sit, what to throw and how fast, from 40-degree water to summer heat.
 Bluegill Spawn Temperature: 67–80 °F, and How to Find the Beds
Bluegill spawn at 67–80 °F (19–27 °C), in waves from late May into August in the north and longer in the south. Where the beds are and how to fish them.
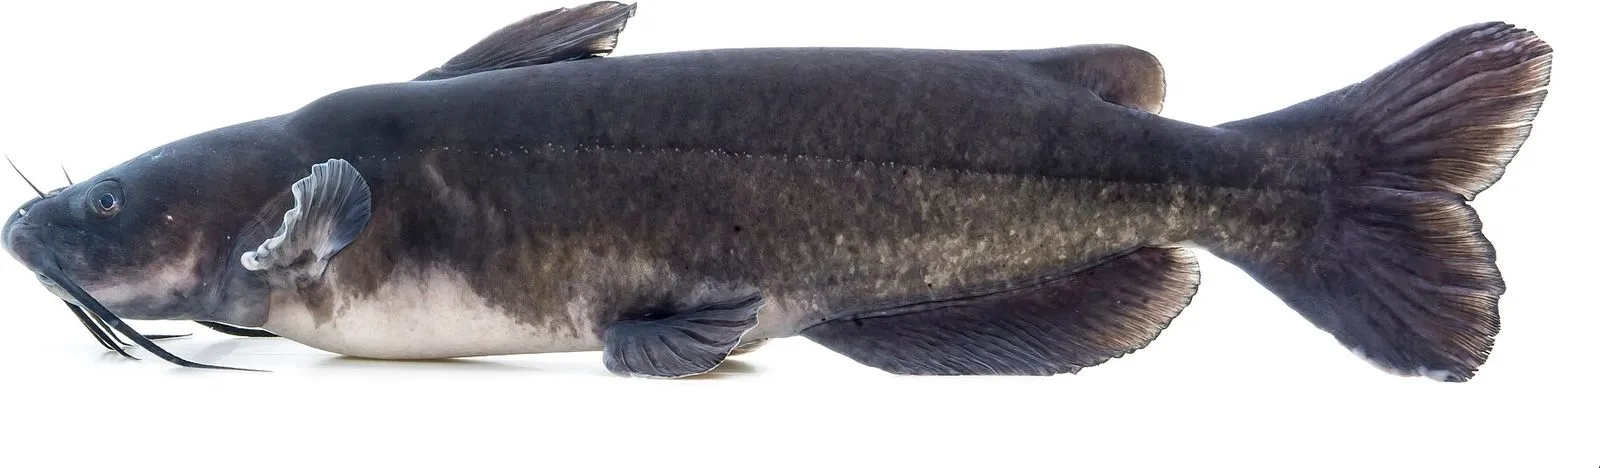 Catfish Water Temperature: When Channels, Blues and Flatheads Bite
Catfish feed hardest at 75–85 °F. The water temperatures where channel, blue and flathead catfish start biting, spawn and quit, and how to fish each band.
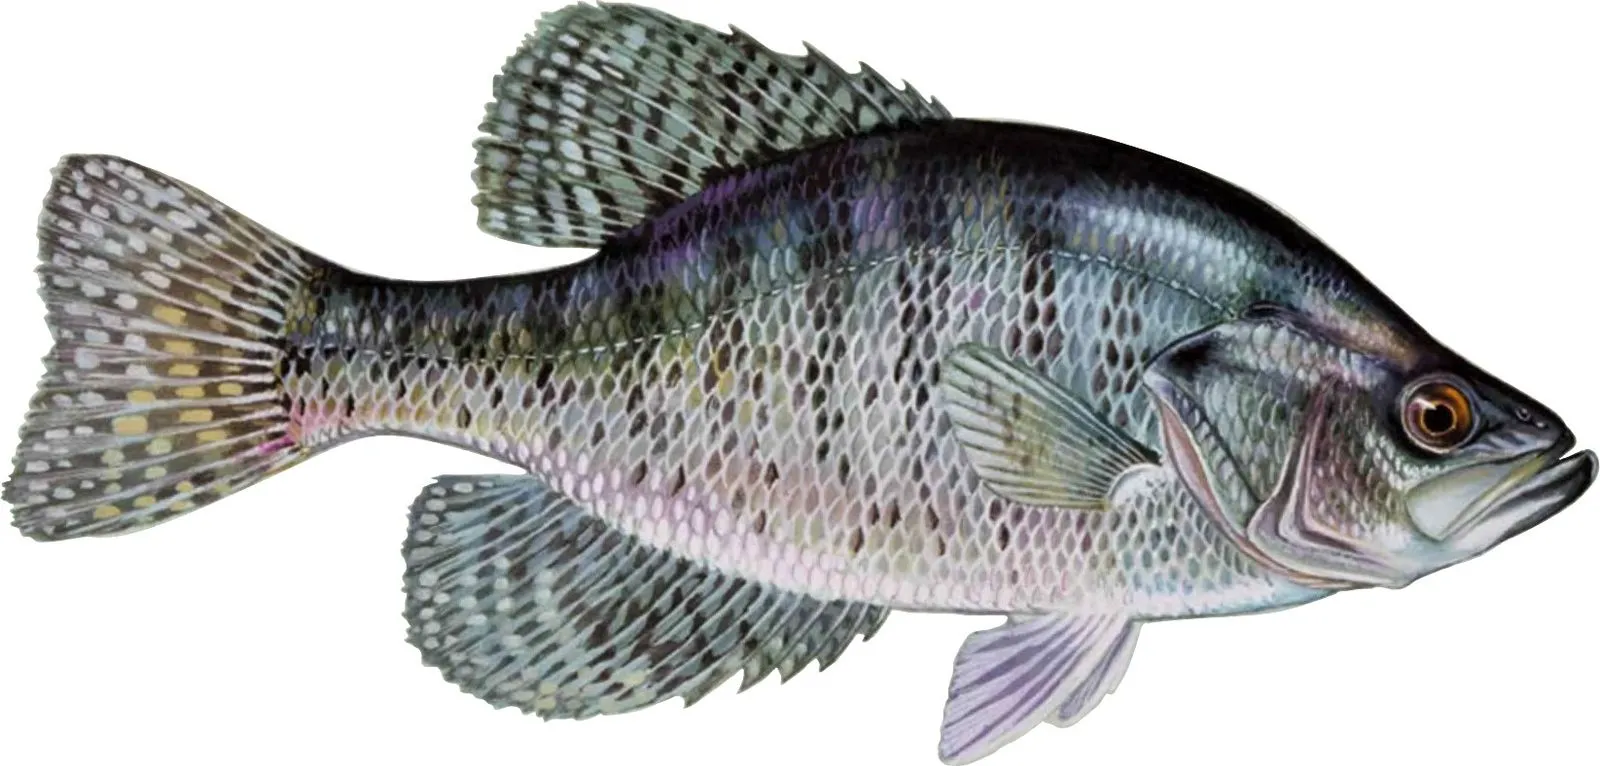 Crappie Spawn Temperature: When They Move Up, How Deep, How Long
Black crappie spawn at 58–68 °F, white crappie at 60–70 °F: when they move up, how deep by water clarity, one spawn a year, and the fall bite.
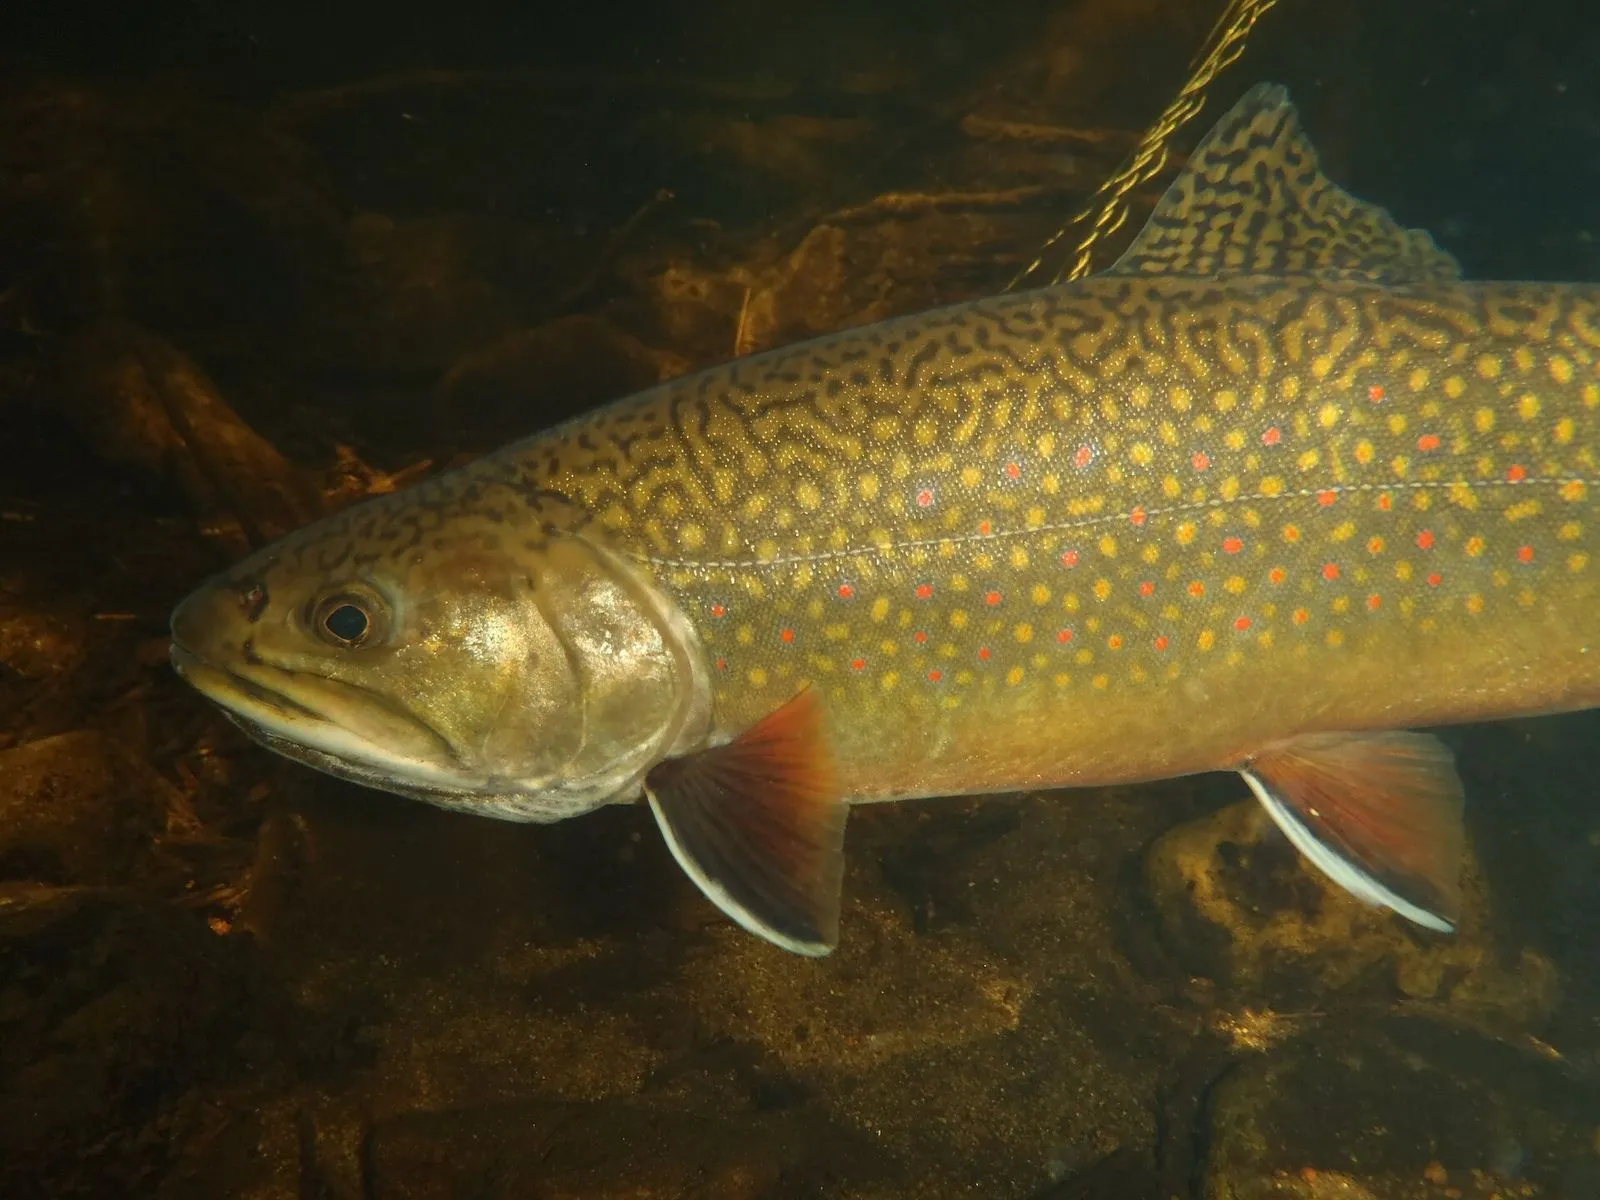 Trout Water Temperature: The 68 °F Line, Limits and Summer Refuges
Trout feed best at 55–65 °F and stress above 68 °F. The chart for five trout species, why anglers stop at 68, and where trout go when rivers warm.
Sources
- USGS Water Data for the Nation (National Water Dashboard, Explore USGS Water Data, Water Data APIs)
- USGS Water Data for the Nation blog, WaterServices degradation and decommission schedule (2026)
- NOAA CO-OPS Tides and Currents (water temperature stations on the coasts and Great Lakes)
- NWS Great Lakes observations (GLOBS)
- NOAA CoastWatch Great Lakes, GLSEA lake surface temperature (daily, AVHRR and VIIRS)
- LakeMonster, lake maps and water temperature layer (pricing and refresh rate)
- Omnia Fishing, Is Omnia's water temperature layer accurate?
- Kettle, H., Thompson, R., Anderson, N. J. and Livingstone, D. M. (2004), Empirical modeling of summer lake surface temperatures in southwest Greenland, Limnology and Oceanography 49(1):271–282
- Piccolroaz, S., Toffolon, M. and Majone, B. (2013), A simple lumped model to convert air temperature into surface water temperature in lakes, Hydrology and Earth System Sciences 17:3323–3338
- Ptak, M., Sojka, M. and Nowak, B. (2019), Characteristics of daily water temperature fluctuations in Lake Kierskie (West Poland), Quaestiones Geographicae 38(3)
- Matuszek, J. E. and Shuter, B. J. (1996), An empirical method for the prediction of daily water temperatures in the littoral zone of temperate lakes, Transactions of the American Fisheries Society 125:622–627
- fishing.info, live water temperature coverage check of 20 lakes (2026-10-10, USGS Water Data API and NOAA CO-OPS)