Free PDF · 16 pages
Know what's biting before your first cast
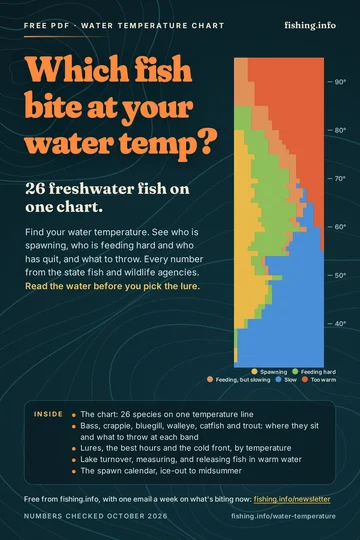
Take one water temperature reading, find it on The Water Temperature Fishing Chart, and see which of 26 freshwater fish are spawning, feeding hard or slowing down. Six pages go deeper: where bass, crappie, bluegill and walleye sit at every band and what to throw, catfish by species, and for trout the 68 °F line where you stop. Sixteen pages, one version for your phone and one to print for the tackle box. Enter your email below and the PDF is in your inbox.
The chart's numbers come from state fish and wildlife agencies and fisheries research: 61 sources, each listed on the site.
What's inside the chart
- The 26-fish chart on one temperature line. Find your reading and read down: who is spawning, who is feeding hard, who has slowed and who has quit. Bass, crappie, bluegill, walleye, catfish, trout, pike, muskie, perch, carp, salmon and more.
- Where they sit and what to throw, at every temperature. A page each for bass, crappie, bluegill, walleye, catfish and trout: the three numbers and where the fish are at every temperature, with what to throw for bass, crappie, bluegill and walleye, the three catfish side by side, and for trout the 68 °F line where you stop. Print just the page for the fish you chase.
- The best hours of the day, by water temperature. When the bite comes in cold water, in the comfort zone and in the heat of summer, and why.
- What a cold front does to the bite, day by day. The pattern most anglers blame on the moon, and how far to back up when it hits.
- The three thermometer mistakes that make a reading lie. The surface is not the depth you fish, the morning number misleads, and the gauge below a dam fools everyone. The 60-second way to a reading you can trust.
- Lake turnover, the spawn calendar and releasing fish in warm water. Has your lake turned and where did the fish go; 26 fish in one list, from burbot spawning under the ice to catfish at 75 °F; and the temperature at which the honest choice is to stop.
Plus the one thing no other chart tells you: the temperature that shuts channel catfish down while blue catfish keep biting all winter. It's on the catfish page.
How it reaches you
- Enter your email above. That's the only field: no name, no phone.
- Click the confirm link in the email we send you. One click, and it keeps bots off the list.
- The chart arrives a minute later, both versions: the dark pages that read well in the sun on your phone, and the white print version that is light on ink and ends with a log page.
From then on it's one email a week: what's biting now, one fact worth repeating at the water, and the new pages worth your time. Leave with one click at the bottom of any email. Your address is never sold or shared; what we store and why is on the privacy page.
Who made it
The chart is built from the water temperature pages on fishing.info, researched by Jeroen Leidelmeijer from state fish and wildlife agencies and the fisheries literature (61 sources on the hub page alone). The numbers are checked again whenever a page changes, and new sign-ups always get the current file.
Free PDF · 16 pages
Know what's biting before your first cast
The Water Temperature Fishing Chart. Take one water temperature reading, find it on the chart, and see which of 26 freshwater fish are spawning, feeding hard or slowing down. Six pages go deeper: bass, crappie, bluegill, walleye, catfish and trout. For your phone and the tackle box.
- Where they sit and what to throw at every temperature: bass, crappie, bluegill and walleye. Catfish, one by one. Trout: the 68 °F line where you stop, and where they hide
- A bass that drops 3 ft feels more pressure change than the biggest cold front: the front day by day, and what to throw on each
- The three thermometer mistakes that make a reading lie (the first one is the surface)
- The 26-fish chart: who's spawning, feeding hard or slowing down at your reading
The chart's numbers come from state fish and wildlife agencies and fisheries research: 61 sources, each listed on the site.
Enter your email, confirm it with one click, and the PDF is in your inbox. Plus one email a week on what's biting. Unsubscribe anytime. Privacy.
P.S. The angler next to you is guessing. One reading, one look at the chart, and you're not. Enter your email above and it's yours.