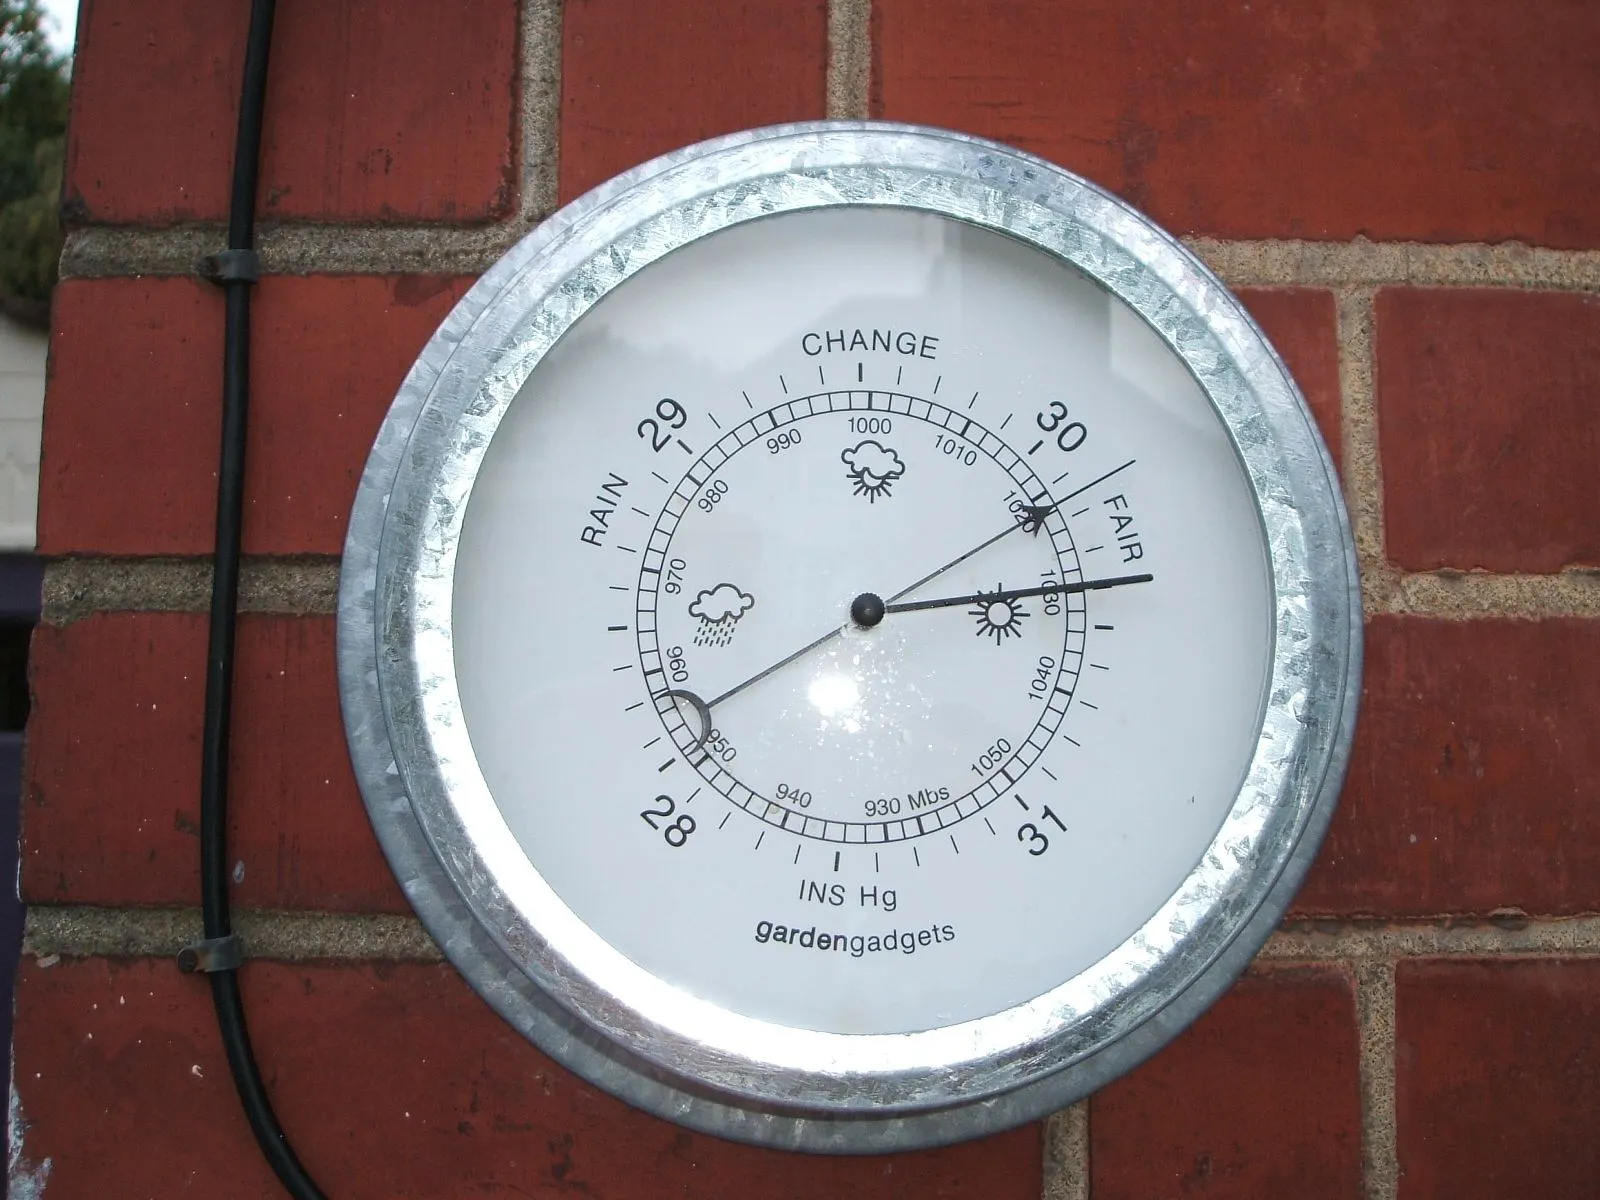
The chart on every weather-station blog puts the best barometric pressure for fishing at 29.70–30.40 inHg (1006–1029 hPa) and calls a falling needle the best of all. No study stands behind that chart, and the pages that print it disagree on whether falling or rising is better. The one long-term catch study that tested pressure found nothing. The barometer is still worth reading, as what it is: a weather forecast.
A cold front swings the barometer from 29.2 to 30.4 inHg (990 to 1030 hPa), which to a fish equals 16 in (41 cm) of water. A bass that rises 3 ft (1 m) off the bottom changes its pressure more than any hurricane on record.
What pressure does the chart call best?
Tempest, AcuRite and Kestrel sell weather stations, and each publishes the same five bands, word for word, without a study behind them. Here they are with the metric figure and the one column nobody adds: how much water depth each band amounts to. Fresh water weighs 0.88 inHg (29.9 hPa) per foot. So a reading converts straight into inches of depth, measured from the standard 29.92 inHg (1013 hPa).
| Band (inHg) | hPa | What the pages claim | Equals this much water |
|---|---|---|---|
| Above 30.50 | above 1033 | High: fish slow and deep, tight to cover | 8 in (20 cm) deeper than standard |
| 29.70–30.40 | 1006–1029 | Normal: fish as usual | 3 in shallower to 7 in deeper (8 to 17 cm) |
| 29.60 and below | 1002 and below | Low: fish slow, sluggish | 4 in (11 cm) shallower than standard |
| Falling | any | Best fishing (Tempest, AcuRite, Kestrel); “can often ruin fishing” (Florida FWC) | 0.3–0.8 in (1–2 cm) per hour in a storm |
| Rising after a front | any | Sluggish for 24–48 h (the band pages); better than falling (Mossy Oak) | back up the same 16 in (41 cm) over a day or two |
Once the depth column is there, the chart’s questions answer themselves. Is 30.30 high for fishing? It sits inside the “normal” band and equals 5 in (13 cm) of extra depth. Is 29.8 high? No: it is 0.12 inHg below standard, less than a fish can even detect. Do fish like high or low pressure? Nobody has shown they care about either.
Is rising or falling better? Three retail blogs say falling and Mossy Oak says rising. The Florida Fish and Wildlife Conservation Commission writes that “a downward trend can often ruin fishing.” When the sources split three ways on the central claim, the claim is lore.
Can a fish feel the barometer at all?
Yes, a little, and the numbers are what make the chart fall apart. A 2010 study showed that a fish senses pressure through its swim bladder, the gas-filled organ it uses to hold its depth. The threshold is about 0.05 m of water: roughly 2 in (5 cm), or 0.14 inHg (4.9 hPa) of atmosphere. So a bass can register the difference between 29.92 and 30.30 inHg. It registers the same difference every time it tilts 5 in (13 cm) downward to eat a crawfish.
Now scale up. A 0.3 inHg (10 hPa) move on the barometer, a big day of weather, equals 4 in (10 cm) of depth. A storm barometer falls 0.02–0.06 inHg per hour, which is 0.3–0.8 in (1–2 cm) of water per hour. The entire swing of a strong cold front, 29.2 to 30.4 inHg, equals 16 in (41 cm), the same 4 percent Hal Schramm quotes in In-Fisherman.
David Ross of Woods Hole put it plainly: a fish that rises 3 ft (1 m) changes its pressure by a tenth of an atmosphere, more than any hurricane has ever delivered. The atmosphere’s own daily tide is about 1 hPa, twice a day, and no fish notices.
So a fish can detect a front, but only as the equivalent of drifting 16 in (41 cm) upward over two days. It does that, and undoes it, every few minutes of its life. The barometer is not a fish switch. It is the best weather forecast on the boat.
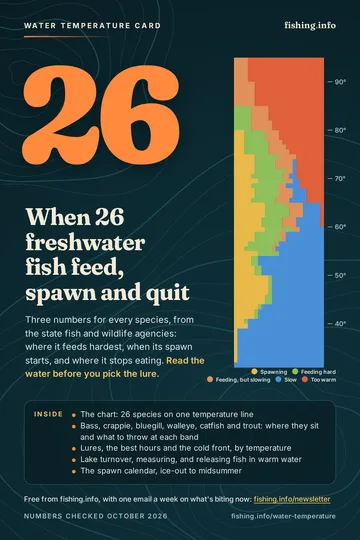
Free card: what 26 species do at your water temperature
Plus one email a week on what's biting now. No sales pitches. Privacy.
How to read a barometer as a weather forecast
Standard pressure is 29.92 inHg (1013 hPa). Most days in the United States read between 29.8 and 30.2; day-to-day extremes run 28.9 to 30.7 (980–1040). The records, 31.58 inHg at Northway, Alaska, in 1989 and 28.20 at Canton, New York, in 1913, are 46 in (117 cm) of “depth” apart. What the needle is good for is the trend over the last three to six hours, because that trend is the weather of the next twelve.
- Falling fast, 0.04 inHg (1.4 hPa) an hour or more: the cold front is inside twelve hours. This is the pre-front window most sources agree on, and the reason is the warm wind and cloud that come with it, not the needle. Fish moving baits on the windward bank until the wind turns. At the first thunder, leave. The National Weather Service rule: off the water when thunder follows lightning within 30 seconds, and stay off until 30 minutes after the last clap.
- Falling slowly, sky graying: cloud is the gift. Lower light keeps fish shallower and feeding later into the morning. Fish topwater and a spinnerbait an hour longer than a bright day allows.
- Rising fast the morning after: the classic post-front day. Cold, bright, wind shifted to the north. The slowdown is real in Schramm’s catch logs (under five bass per hour), unproven as pressure. Slow down, fish tight to cover, downsize, and fish the warmest water of the afternoon.
- High and steady, 30.30 or more, bluebird sky: the problem is light. A 13-year creel study at Escanaba Lake, Wisconsin, found that sunlight, not pressure, cut walleye success. Fish the shade side of cover, the deeper edge of the flat, and the first and last hour of daylight.
- Low and steady, 29.60–29.80, gray and drizzling: nothing is wrong. This is the reading the chart calls “sluggish” and the weather every experienced angler hopes for. Low light spreads the bite across the day; fish normal depth at normal speed.
- Flat inside the normal band: ignore the barometer. Pick depth and lure by the water temperature and the time of day. The needle has told you all it knows.
What to change instead, by species
Bass. A front changes the light, the wind and the surface temperature, and each of those has a better-supported response than the pressure reading. Post-front, fish the shade side of docks and laydowns, drop a step deeper, and slow a jig to a crawl. The bass water temperature bands hold the depth and speed for each reading. A front that knocks a flat back 8–10 °F (4–6 °C) moves the fish back a row in that table, and that is the change to fish.
Crappie. The one species with movement data. Telemetry from 1992 and Craig Bonds’ tracking for Texas Parks and Wildlife had crappie on the move during pressure changes and deeper around fronts. Fish brush piles 2–3 ft (0.6–0.9 m) deeper than last week and hold the jig still.
Walleye and muskie. The Escanaba creel is the best guide. Sunlight lowered walleye success, so a high, bright post-front day is a dawn, dusk and deep-edge day. Wind lowered the muskie catch, so a muskie angler wants the calm side of the front, not the windy one.
Catfish. No pressure study exists for catfish, and none for bluegill or trout. The same fronts bring rain, inflow and a shift in water temperature, and catfish move on those. Fish the inflows and the mud line after the rain, not the reading.
What have the studies found?
| Study | What was tested | Result |
|---|---|---|
| Taylor et al. 2010, J R Soc Interface | Swim-bladder pressure sensing | Threshold about 0.14 inHg (4.9 hPa), or 2 in (5 cm) of depth |
| VanderWeyst 2014, Bemidji State | Yellow perch feeding under rising and falling pressure, 12 lab trials | No effect on consumption; small study, undergraduate, not peer-reviewed |
| Shaw, Renik & Sass 2021, PLOS ONE | 13 years of compulsory creel records, Escanaba Lake, Wisconsin | Pressure not significant for walleye trip success (p=0.12) or catch rate (p=0.91); negligible for muskie |
| Guy, Neumann & Willis 1992; Bonds (TPWD) telemetry | Crappie movement through pressure changes | Black crappie moved more as pressure rose; white crappie moved during changes and went deeper around fronts |
| Manns, Lake Travis bass logs (In-Fisherman 2017) | Strikes by pressure level and trend | 52% of strikes below 29.30 inHg vs 39% above 29.70; slow-falling 65% vs slow-rising 30%; the author calls it unproven |
| Heupel et al. 2003, J Fish Biol | Juvenile blacktip sharks before Tropical Storm Gabrielle | Left the bay as pressure fell |
| Stoner 2004, J Fish Biol review | Which conditions change catchability | Temperature, light, current and prey density, by up to tenfold; pressure not a featured variable |
The only direct feeding test is the perch study: twelve trials, no effect either way, and too small to settle anything. The best catch study is the Escanaba Lake creel, where every angler for thirteen years had to report the trip. Pressure did nothing measurable for walleye. Solar radiation cut success (p≈0.04), wind cut the muskie catch (p=0.03), and moon variables and angler skill mattered most.
Ralph Manns’ bass logs from Lake Travis are the strongest numbers on the pro-pressure side. More than half his strikes came below 29.30 inHg, and slow-falling pressure beat slow-rising by more than two to one. Then Manns himself lists the confounders. A falling needle in Texas arrives with warm south wind and cloud, a rising one with a bright, cold, calm sky. His verdict is that no study demonstrates a pressure effect on bass, because his data cannot separate the needle from the weather it announces.
The crappie work is the one place where fish visibly move with pressure, and even there they went deeper around the front, not the reading. The sharks that fled the storm felt a fall many times steeper than any freshwater angler will fish through.
The weather for fishing guide ranks every condition by the evidence behind it. The ranking runs almost the reverse of the lore: light and time of day first, water temperature next, wind and cloud, and pressure last. The barometer still earns its place on the boat. It just answers a different question than the chart says it does.
Free download
The water temperature card
Read your water temperature and the card tells you who is spawning, who is feeding and what to throw. 26 species, 16 pages, for your phone and the tackle box.
Plus one email a week on what's biting now. No sales pitches. Privacy.
Related
Section guide
Fishing Weather: What Wind, Cloud, Pressure, Rain and the Moon Really Do to the BiteWhat weather is good for fishing, ranked by the evidence: light and hour first, then temperature trend, wind and cloud, the moon, and last the barometer.
 Best Time of Day to Fish: Dawn, Dusk, Midday and Night, Species by Species
Dawn and dusk beat midday for most fish, and catfish, walleye and big brown trout bite after dark. A species-by-species table of when to go.
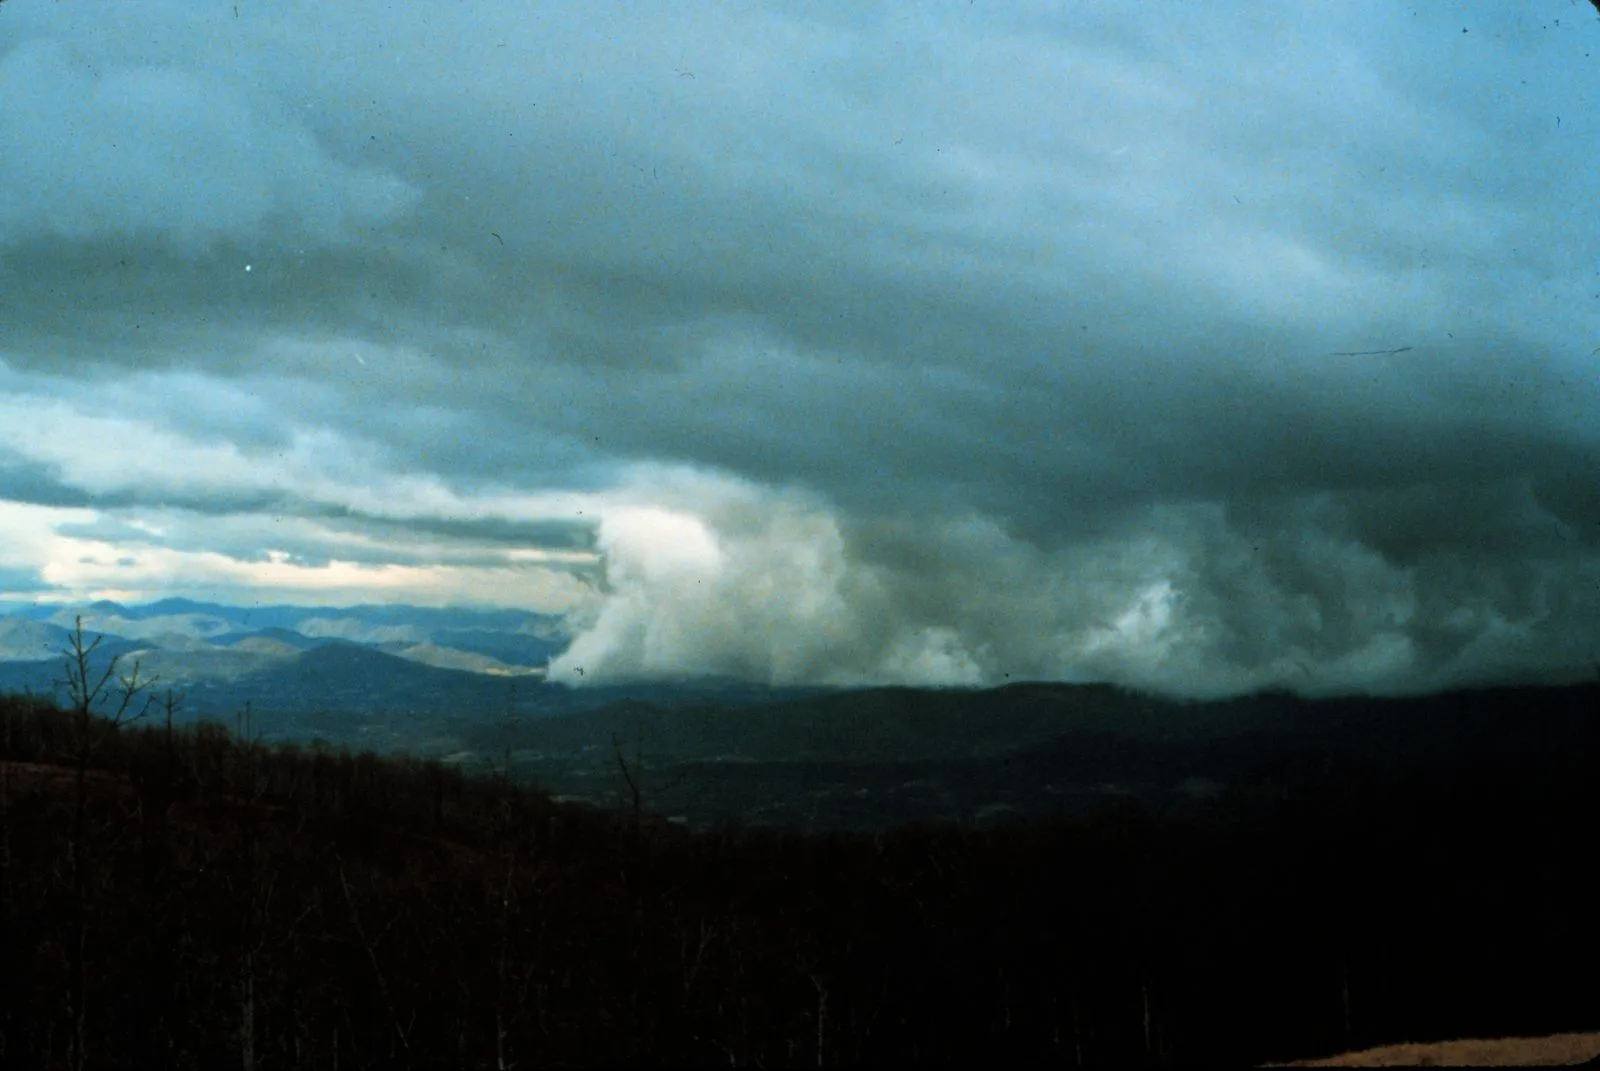 Cold Front Fishing: A Day-by-Day Plan for the Front, the Bluebird Days After, and the Wind
Cold front fishing day by day: the pre-front window, why days 1–2 after run slow, what to change, and when wind helps the bite.
 Moon Phase Fishing: The Solunar Theory, the Studies That Tested It, and a Verdict for Each Phase
No moon phase reliably out-fishes another: a 1,355-hour trout test found no solunar effect. Where the moon does matter, and a verdict per phase.
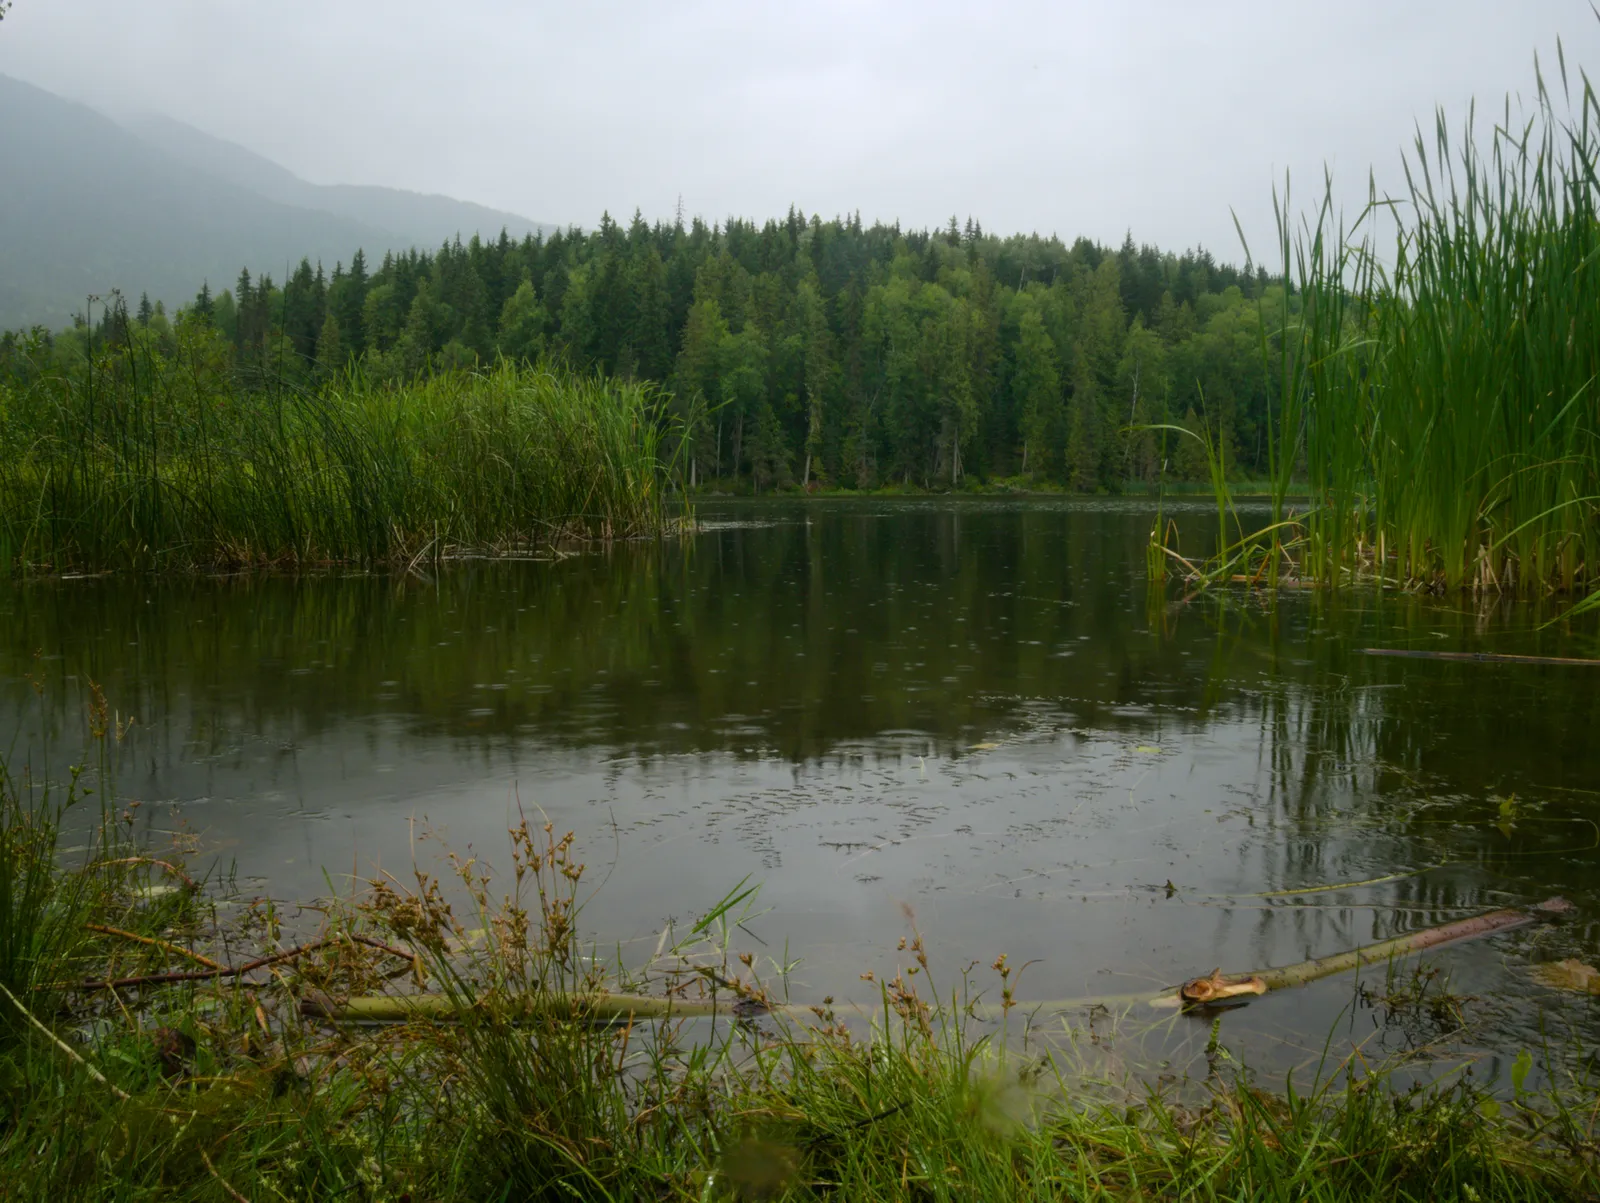 Fishing in the Rain: What Really Improves the Bite Before, During and After a Shower
Fishing in the rain works because of cloud, cooling and runoff, not the drops. Before, during and after a shower, by species, plus the lightning rule.
Sources
- Taylor, G. K. et al. (2010), Sensing the depth: fish swim-bladder pressure sensitivity, Journal of the Royal Society Interface
- Shaw, S. L., Renik, K. M. and Sass, G. G. (2021), Angler catch rates of walleye and muskellunge at Escanaba Lake, Wisconsin, 2003–2015, PLOS ONE
- VanderWeyst, D. (2014), The effect of barometric pressure on feeding activity of yellow perch, Bemidji State University
- Guy, C. S., Neumann, R. M. and Willis, D. W. (1992), Movement patterns of adult black crappie, Journal of Freshwater Ecology
- Heupel, M. R., Simpfendorfer, C. A. and Hueter, R. E. (2003), Running before the storm: blacktip sharks respond to falling barometric pressure, Journal of Fish Biology
- Stoner, A. W. (2004), Effects of environmental variables on fish feeding ecology: implications for catchability, Journal of Fish Biology
- Manns, R. (2017), Barometric Pressure and Bass, In-Fisherman
- Schramm, H. (2017), The Effects of Cold Fronts on Bass, In-Fisherman
- Straw, M. (2014), Crappies: Weather Vanes of the Fishing World, In-Fisherman
- Ross, D. (2010), The Pressure Myth, MidCurrent
- Florida Fish and Wildlife Conservation Commission, freshwater fishing tips
- Tempest, Barometric pressure and fishing (the band chart)
- Mossy Oak, The fishing and barometric pressure relationship
- Atmospheric pressure: standard value, ranges and records
- National Weather Service, lightning safety